
Our Forests | Timelapse in Google Earth

This resource has been reviewed by SubjectToClimate's climate scientists and verified for scientific accuracy and up-to-date information. Learn about our review process →
Provided by: Google Earth|Published on: April 27, 2021
VideosScientist Reviewed
6789101112
Scientist Reviewed This resource has been reviewed by SubjectToClimate's climate scientists and verified for scientific accuracy and up-to-date information. Learn about our review process →
Synopsis
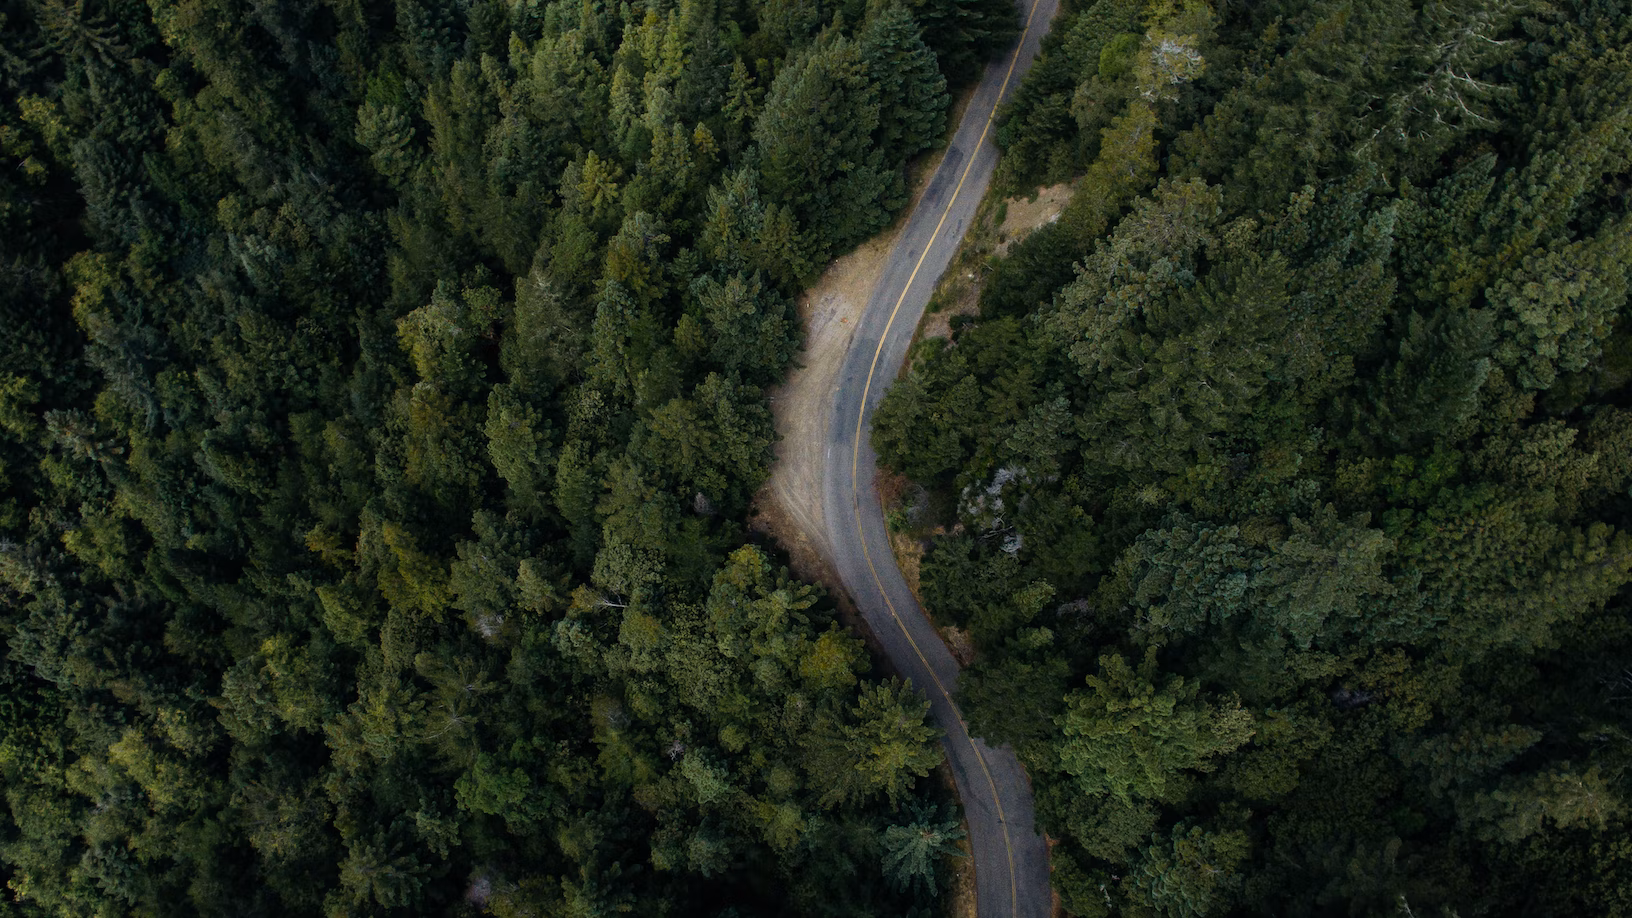
- This video takes students on a virtual trip to five different locations around the world, depicting the changes happening to our world’s forests over time from satellite images.
- The five locations are Nuflo de Chavez, Bolivia; Enright, Oregon, USA; Atsimo-Andrefana, Madagascar; Sara, Bolivia; and Mato Grosso, Brazil.
- Students will see the extent of deforestation in those locations from 1984-2020.
Subjects: Biology, Earth and Space Sciences, Geography
Authors: Google Earth
Region: Africa, North America, South and Central America, USA - West, United States, Global, Oregon, Oregon Coast
Languages: English
Teaching Materials
Positives
- The music and sound effects make the content more engaging.
- It contains short facts and information about deforestation that make it powerful and informative.
Additional Prerequisites
- Students should understand that satellite images are real pictures taken of the Earth from space.
Differentiation
- Teachers could play this video before a discussion about deforestation, economic growth, population growth, per capita consumption growth, or biodiversity loss.
- 3rd-5th graders could observe the reduction in green cover from 1984-2020, while middle and high school math students could estimate the surface area of forest lost in the images.
- The short facts that pop up could be used for social studies, biology, or ethics classes when discussing sustainability, the rights of other species to exist, how much we rely on natural ecosystems to survive, or how to design economies to support a sustainable future.
- Click here for a similar resource from Google Earth on Changing Forests.
This resource spotlights the rate of deforestation and other land use changes from a variable time span (1984-2020) in selected countries. There is no contradiction in facts as presented in the resource. This resource is recommended for teaching.
Teaching Tips
Standards
Resource Type and Format
Scientist Reviewed
This resource has been reviewed by SubjectToClimate's climate scientists and verified for scientific accuracy and up-to-date information. Our review process ensures that every resource in our library reflects the current state of climate science.
Learn about our review process →