
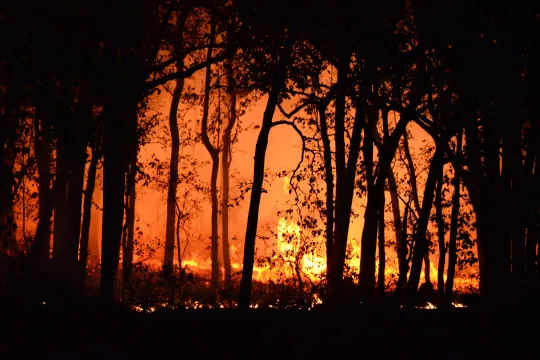
Analyzing the Rise of U.S. Wildfires

This resource has been reviewed by SubjectToClimate's climate scientists and verified for scientific accuracy and up-to-date information. Learn about our review process →
Provided by: ACE|Published on: April 27, 2021
Lesson PlansInterdisciplinaryScientist Reviewed
9101112
Scientist Reviewed This resource has been reviewed by SubjectToClimate's climate scientists and verified for scientific accuracy and up-to-date information. Learn about our review process →
Synopsis
- In this lesson, students will learn about the effects of rising temperatures on forests, such as the Redwood forest, and wildfires, complete a graphing exercise, answer questions, and have a class discussion about the topics presented.
- The lesson plan contains a teacher guide, student worksheet, data tables, article, and links to additional information.
Subjects: Biology, Earth and Space Sciences, Mathematics
Authors: ACE
Region: North America, USA - West, United States, California
Languages: English
Teaching Materials
Positives
- The connection between temperature and acres burned will slowly be revealed as students create the graph.
- The data tables are provided in Excel and Google Sheets.
Additional Prerequisites
- The y-axis on the right side is missing 0°F. That might be tricky for some students. Explain that 0° is actually there. It is simply not labeled.
- Feel free to extend the data to include more recent years (2019 and on). Use NOAA for temperatures and NIFC for acres burned.
- Temperature anomalies must always use a baseline value. The baseline used in this data from NOAA is the mean temperature from 1901-2000. Note that other mean temperature ranges may also be used, such as the 1950-1980 mean or the mean temperature prior to the Industrial Revolution.
- Teachers must create a free account to access the materials.
Differentiation
- It may be useful to group students of mixed ability so they can assist one another while creating their graphs.
- Students can choose a color and shape for each point they plot on the map. The temperature anomaly uses a black triangle. Students can choose something like a red circle or green square to plot acres burned.
- Other resources about this topic include this resource about climate feedbacks and wildfires, this wildfire activity about biomass loss, and this NASA resource about the effects of climate change.
Framework for Shifting Paradigms in Climate Education
This resource exemplifies the Interdisciplinary Key Focus Area.
- Core Component 1: Integration of Multiple Perspectives and Disciplines
- Students engage in data analysis by graphing and interpreting the relationship between surface temperature and wildfire burn area, integrating math and science skills. They also hear a first-person account from a young person impacted by wildfires and pine beetles, bringing in personal and social perspectives that deepen understanding and spark peer discussion.
- Core Component 2: Promoting Inquiry-Based and Project-Based Learning
- Instead of being directly taught the connection between temperature rise and wildfire severity, students are invited to discover it through hands-on graphing and analysis. This inquiry-based approach encourages critical thinking and supports students in drawing their evidence-based conclusions.
- Core Component 3: Emphasis on Diversity, Sustainability, and Connection to Nature
- The lesson highlights sustainability by connecting environmental data to real-world climate impacts and solutions. A student-led call to action emphasizes the urgency of climate mitigation strategies while fostering a sense of personal agency and responsibility in caring for the natural world.
- The lesson highlights sustainability by connecting environmental data to real-world climate impacts and solutions. A student-led call to action emphasizes the urgency of climate mitigation strategies while fostering a sense of personal agency and responsibility in caring for the natural world.
Rising mean temperatures cause pine beetles to infest on trees thereby causing tree dryness and loss, which in turn accelerates the occurrence of wildfires. This resource explores the trend of rising temperatures and wildfire events in the Western part of the USA. It is suitable for students to examine these relationships and the causal factors. Thus, the resource is recommended.
Teaching Tips
Standards
Resource Type and Format
About the Partner Provider

Action for the Climate Emergency (ACE)
Action for the Climate Emergency (ACE)'s mission is to educate, inspire and support young people to lead the fight for their future. To achieve their mission, ACE ensures young people have everything they need to understand the science of climate emergency and advocate for solutions.
Scientist Reviewed
This resource has been reviewed by SubjectToClimate's climate scientists and verified for scientific accuracy and up-to-date information. Our review process ensures that every resource in our library reflects the current state of climate science.
Learn about our review process →